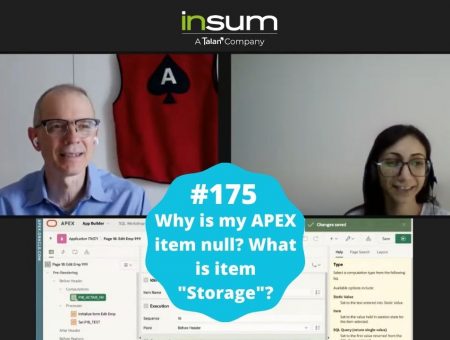
This week, special guest Joel Kallman joins Hayden and Anton to show how one can remote debug a user’s session using:
Monitor Activity — Active Sessions — Enable Debug.
Setting the Debug Level to ‘APEX Trace’ will get you the query’s execution plan.
Not an APEX Workspace Administrator? Not to worry! Joel’s got you covered with a set of queries you can build right into your app.
View Past Episodes
Full episode list on YouTube here.
Past Episodes
APEX Instant Tips #177: The second 5 minutes of almost every code review
For this episode, log into your APEX development workspace and follow along with this code review....
Read moreAPEX Instant Tips #176: “Session State Protection” vs “Value Protected”
2 settings, Session State Protection and Value Protected, and 3 places they can apply. Anton and...
Read moreAPEX Instant Tips #175: Why is my APEX item null? What is item “Storage”?
Be aware of the order of operations in APEX. Keep this in mind: Processes happen before...
Read moreAPEX Instant Tips #174: Dynamic Actions and Order of Execution
Dynamic actions have brought client-side JavaScript to everyone, but it is still important to understand a...
Read moreAPEX Instant Tips #173: Naming User Preferences
Anton teams up with very special guest Hayden Hudson to add a follow up on epsisode...
Read moreAPEX Instant Tips #172: Region Template Best Practices
Standard? Blank with Attributes? Blank with Attributes (No Grid)? When should I use each of these...
Read moreAPEX Instant Tips #171: APEX v24.2 Opening Modal Dialog Pages
When upgrading to APEX v24.2 be sure to fix custom javascript that opens modal dialog pages...our...
Read more


